Air Pollution Causing Nuisance Conditions
GAF Operations Are Creating “air pollution,” “nuisance conditions,” and “adverse impacts” as defined by the City and State
City of Dallas Definitions
CHAPTER 5A AIR POLLUTION
SEC. 5A-1. SHORT TITLE.
This chapter may be cited as the Dallas Clean Air Ordinance. (Ord. 15079)
SEC. 5A-2. DECLARATION OF POLICY.
It is the policy of the city of Dallas to safeguard the air resources of the city from air pollution and to promote the protection of the health, safety, general welfare, and physical property of the people within the city by regulating emission of air contaminants and by controlling or abating air pollution. The provisions of this chapter are to be construed, according to the fair import of their terms, to effect this policy. (Ord. 15079)
SEC. 5A-3. CHAPTER DEFINITIONS.
The definition of a term in this section applies to each grammatical variation of the term. In this chapter, unless the context requires a different definition:
(1) AIR CONTAMINANT means dust, fumes, gas, mist, odor, particulate matter, toxic materials, smoke, or vapor, individually or in combination, that is produced by a process other than natural.
2) AIR POLLUTION means the presence in the atmosphere of one or more air contaminants in such concentration and of such duration:
(A) as to have or tend to have an injurious or adverse effect on human health or safety, animal or vegetable life, or property; or
(B) as to interfere with the normal use or enjoyment of animals, vegetation, or other property.
SEC. 5A-7. CITY AIR POLLUTION STANDARDS.
c) Odors (emission standard). A stationary source may not emit beyond its property line an odor, the strength of which equals or exceeds two odor units, as measured by the director on a Barnaby-Cheney Scentometer or equivalent odor-testing.
State of Texas Definitions
HEALTH AND SAFETY CODE
TITLE 5. SANITATION AND ENVIRONMENTAL QUALITY
SUBTITLE C. AIR QUALITY
CHAPTER 382. CLEAN AIR ACT
SUBCHAPTER A. GENERAL PROVISIONS
(2) “Air contaminant” means particulate matter, radioactive material, dust, fumes, gas, mist, smoke, vapor, or odor, including any combination of those items, produced by processes other than natural.
(3) “Air pollution” means the presence in the atmosphere of one or more air contaminants or combination of air contaminants in such concentration and of such duration that:
(A) are or may tend to be injurious to or to adversely affect human health or welfare, animal life, vegetation, or property; or
(B) interfere with the normal use or enjoyment of animal life, vegetation, or property.
By City & State Definitions GAF PM Pollution is Harmful
GAF’s Particulate Matter pollution is causing “air pollution,” “nuisance conditions,” and “adverse impacts” as defined by the City and State
Both of GAF’s two production lines at their West Dallas shingle factory are permitted to run 24 hours a day, 365 days a year.
The Texas Commission on Environmental Quality and the U.S. Environmental Protection Agency classifies a polluter as a Major Source if it is capable of releasing 100 tons or more of a single pollutant annually. Being listed as a Major Source by the EPA means a polluter is capable of releasing 100 tons a year or more of one of EPA’s six “Priority Pollutants,” including Particulate Matter.
GAF became an EPA Major Source for Particulate Matter in 2004, when the State of Texas’ own review of the company’s computer air pollution modeling revealed that the factory was violating the National Ambient Air Quality for PM pollution.
However, it is likely GAF had been violating the standard ever since its second line began operation in 1982. GAF’s pollution control devices had never been stack tested for their effectiveness in removing PM pollution during that entire 22-year period. Instead, GAF used computer modeling and its own inaccurate estimates of pollution to keep from being classified as a Major PM polluter.
PM was not the only pollutant to be chronically underestimated by GAF. Over the last 40 years the company has been proven wrong about its estimates of the volume of Sulfur Dioxide, Nitrogen Oxide, Volatile Organic Compounds and Carbon Monoxide its West Dallas factory was releasing into the air.
Despite the track record, in 2022 daily GAF compliance with the National Ambient Air Quality Standard for PM pollution is still determined by the State using GAF’s own computer air modeling, not real time monitoring.
Stack Pollution
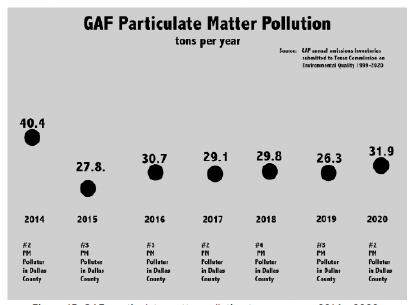
From 2014 to 2020 GAF has self-reported releasing 30 to 40 tons of PM pollution per year. This has made it either the second or third largest industrial polluter in Dallas for six of those seven years.
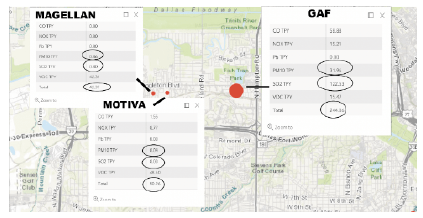
These numbers make GAF the largest PM polluter in West Dallas by a large margin. There is not another Major Source for PM pollution in West Dallas, or even any stationary source that officially registers double digit annual tonnage of PM pollution with regulators.
Diesel Truck and Railroad Pollution
PM from truck and railroad traffic into and out from GAF is not included in any emissions reporting submitted to government regulators.
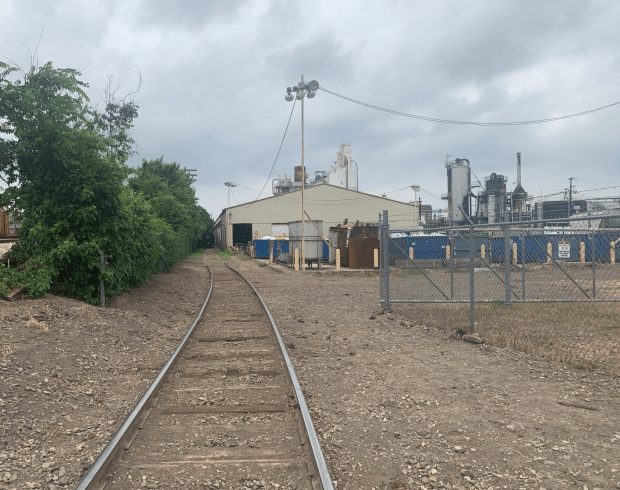
GAF operates its own diesel locomotive on a spur inside the factory. There’s a multi-track Union Pacific switchyard adjacent to GAF providing a steady stream of Flux-filled railcar tankers and serving other heavy industry along the Singleton and Commerce industrial corridor.
Union Pacific and other railroads retire their long haul locomotives to spend their last years for short haul switchyard duty. These switchyard diesel locomotives are often the oldest, and therefore the most polluting, in a railroad’s fleet. Locomotive engines are incredibly large – up to 20 times larger than the V-8 engines in pickup trucks and SUVs. Many locomotives are two-cycle engines which have greater power density and are less costly to manufacture, but have considerably higher emissions than their 4-cycle counterparts. (“Smokestacks on Rails,”Janea Scott, Hilary Sinnamon, Environmental Defense Fund, 2006)
Diesel trucks hauling Flux and other raw materials to the factory, and finished product from it, enter on the north side from Singleton. Neighbors have complained of long lines of idling trucks parked along Singleton.
Exposure to diesel exhaust has been associated with a wide range of health effects including cancer, neurological damage, a weakened immune system, respiratory disease and cardiovascular disease. (Source: U.S. Department of Health and Human Services).
Diesel engines produce a particularly deadly kind of PM pollution called “Carbon Black.” Because of their size, locomotive diesel engines are among the largest Carbon Black polluters. Carbon Black is considered possibly carcinogenic to humans and classified as a Group 2B carcinogen. It’s also been associated with cardiovascular damage. (Source: Kuempel, Eileen D.; Sorahan, Tom (2010).
These two significant sources of PM pollution, although always present as a matter of routine operations, are not included in any estimates of total PM pollution GAF submits to government regulators. This is important to note because more than once in its regulatory history GAF officials have submitted computer air modeling showing the factory barely skirting below federal air standards with just its smokestacks and vents sources included. Adding the PM pollution from rail and truck traffic might have resulted in violating those standards. Regulators and GAF chose to exclude these sources in their estimates of harm. The lungs of West Dallas residents don’t have that choice.
Particulate Matter Pollution Monitor Results
Purple Air Monitor Results
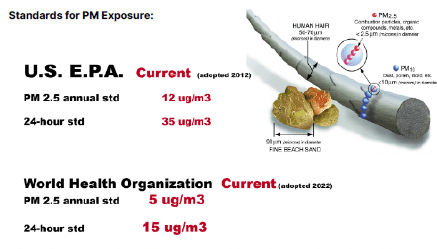
Measuring PM 2. 5
Concentrations of air pollution are measured in ug/m3, or micrograms (one-millionth of a gram) per cubic meter of air. All regulatory standards for PM pollution use ug/m3 measurements.
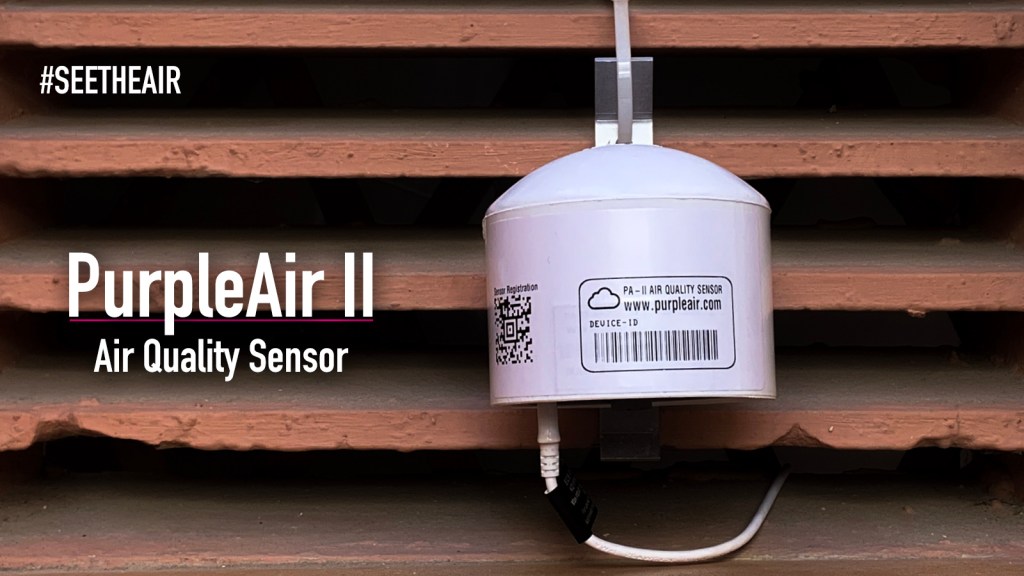
Most PM sensors today, including Purple Air sensor, use lasers to determine their ug/m3 measurements. In Purple Air monitors PM levels are measured based on the Plantower PMS sensor (Beijing Plantower Co., Ltd, Beijing, China). The PMS sensor is a laser-based optical sensor operating at around 650 nm wavelength. This sensor illuminates particles crossing the sensing target volume and the scattered light is collected over a 90-degree sector. The mass concentrations associated with individual size categories are summed to provide estimates of PM1, PM2.5, and PM10. Purple Air monitors used by residents around GAF have two PM sensors (Channels A and B), providing two sets of readings of particle number density and mass concentrations of PM1, PM2.5, and PM10 . Purple Air provides its own calibration formula by applying a proprietary algorithm, “atmospheric” correction factor developed by Plantower Ltd. According to the PMS5003 manual, ATM values should be used for atmospheric monitoring and those corrected numbers are the ones used in this report.
Reliability of Purple Air Data
There are no regulatory air monitors in the vicinity of the GAF factory. The nearest EPA monitor that measures PM pollution is located on Hinton Street by I-35 and Mockingbird, five miles away. Despite its considerable distance from GAF, the company is allowed to use this EPA monitor to determine baseline background levels for West Dallas in its permitting and computer air modeling.
Lacking any government monitors, the only way residents can determine what levels of air pollution they’re being exposed to is to take up the task of monitoring the air themselves. This is the service Purple Air, and similar networks, provide.
Although not as finely-tuned and calibrated as regulatory monitors or even more expensive off-the-shelf monitors, Purple Air monitors have gained a reputation for being able to “effectively monitor PM2.5,” especially in the 0-250 ug/m3 range. (Connolly, R. E., Yu, Q., Wang, Z., Chen, Y. H., Liu, J. Z., Collier-Oxandale, A., & Zhu, Y. (2022)
First Wave of Data: May 2020-May 2021
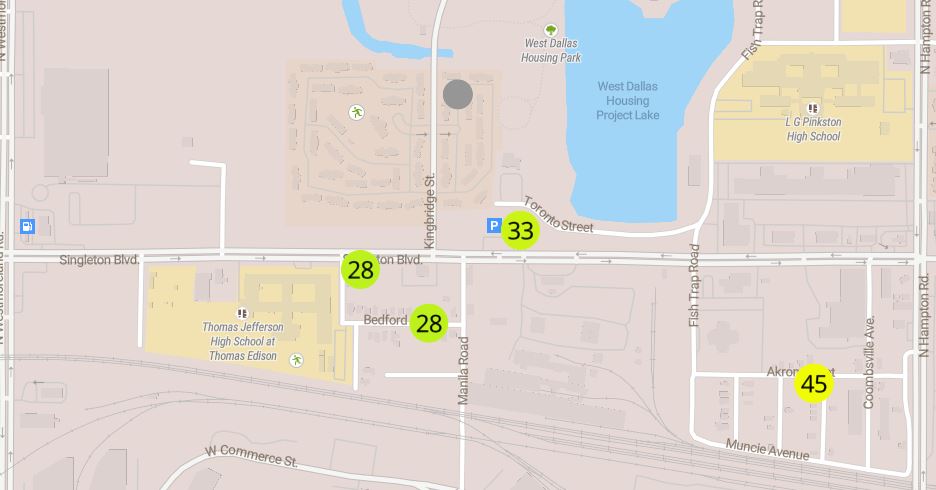
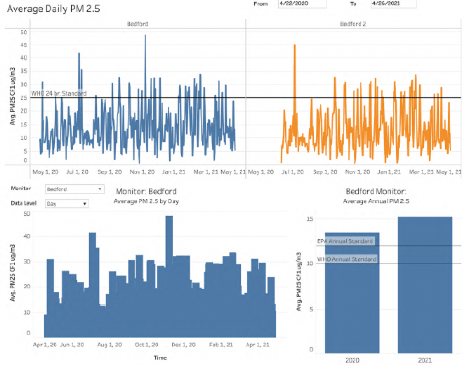
Beginning in April 2020, Legal Aid of NorthWest Texas placed Purple Air monitors on two homes on Bedford Street, directly across the street from GAF to the East/Northeast. After a year’s time, the organization released a summary of the data collected.
It found at least four instances when the US EPA’s 24-hour standard for PM 2.5 of 35 ug/m3 was exceeded. It found at least 31 days when PM 2. 5 levels exceeded the then-World Health Organization’s 24-hour standard of 25 ug/m3, since reduced to 15ug/m3.
Annual averages for the entire year at one monitor exceeded the EPA standard, the former WHO annual standard, as well as the newly-adopted one.
Second Wave of Data: July 2021 to Now
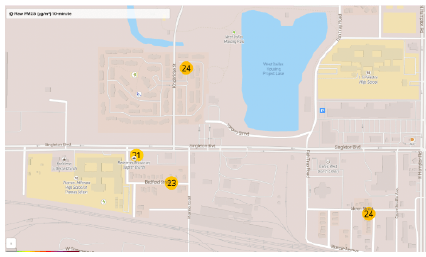
Beginning in July of 2021 Downwinders at Risk deployed up to four Purple Air monitors on the East and North sides of GAF. While one monitor has since been moved, the others remain where they were originally located and provide additional data about the prevalence and severity of PM pollution in the neighborhood.
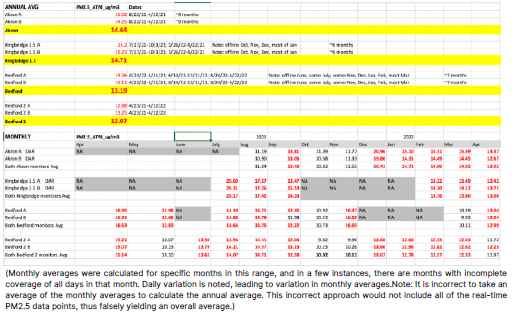
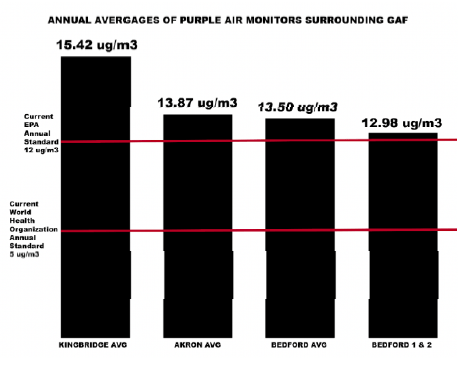
Since going live in July and August of 2021, the averages for all of these monitors have exceeded both the EPA and World Health Organization annual PM pollution standard. Fully 12 out of 18 monthly averages at the Akron Street site exceeded the EPA annual standard of 12 ug/m3. 12 out of 12 monthly averages at the Kingbridge Apartments monitor exceeded the EPA annual standard.
Third Wave of Data: May 2021 to Now
Finally, Legal Aid of North Texas kept their Bedford Street monitors recording until earlier this year. Their data from May 2021 to now provide more evidence of PM’s prevalence in the community. 32 of 44 monthly averages exceeded the EPA annual PM pollution standard.
In total, of 74 monthly PM pollution averages recorded at all GAF Purple Air sites since April 2021, 56 exceeded the EPA’ annual PM standard, or 75.6% of the time. For the equivalent of three quarters of every year, residents living adjacent to GAF are being exposed to levels of PM that exceed the EPA standard, much less the stricter World Health Organization standard.
In contrast, Dallas County’s only EPA PM 2.5 monitor, located on Hinton Street near I-35 and Mockingbird recorded an annual average of only 9 ug/m3 of PM 2.5 in 2021. It’s four miles to the Northeast from GAF and West Dallas and is not located near any specific PM polluter.
This EPA monitor is the one GAF uses in all of its computer modeling to establish “a background level” in predicting the impacts of PM pollution from its West Dallas factory. Using this Hinton Street monitor’s information in 2004, GAF estimated its annual PM emissions came within less than a single ug/m3 of violating the EPA’s standard. The Texas Commission on Environmental Quality accepted the results. GAF used the Hinton Street monitor data again in 2009 for its computer modeling to prove no adverse health impacts from its PM pollution, coming in at only 2 ug/m3 under the EPA standard. Again, this result was accepted by TCEQ.
There’s a five to seven ug/m3 difference between the Hinton Street annual averages and the ones recorded around GAF in West Dallas. Using Hinton Street monitor results instead of ambient PM levels around GAF itself skewed these modeling results away from what’s actually happening in the air in West Dallas, as well as violations of the EPA’s federal standard for PM pollution.
The Hinton Street monitor is also the only one used to assess Dallas County’s compliance with all EPA PM standards, and is the sole basis for the American Lung Association’s State of the Air grading of Dallas County’s PM pollution levels.
Monitoring data collected by residents beginning in 2020 and continuing into the present provides a very consistent and compelling case that this single EPA monitor is vastly underestimating PM exposure in West Dallas.
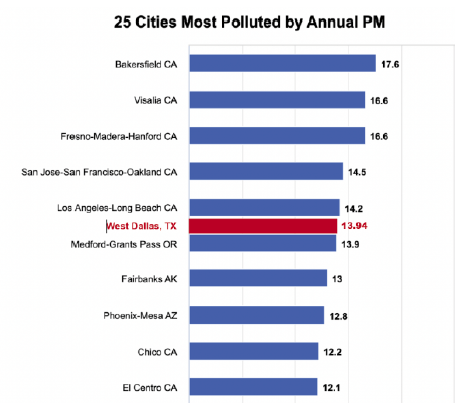
The annual average of 13.9 ug/m3 from all West Dallas Purple Air monitors data would make West Dallas the sixth most PM polluted city in the US according to the American Lung Association’s 2022 State of the Air annual report.

West Dallas was in official EPA “non-attainment” for PM pollution during the 1970’s and 80’s when the notorious RSR lead smelter was belching hundreds of tons of lead into the air. Were EPA to get the same PM pollution numbers with their regulatory monitors as residents are getting from their Purple Air monitors, the neighborhood would once again be in nonattainment.
Read more about the lack of knowledge of the chemical composition of the waste that is used for GAF shingle production, and how the processing causes risk of catastrophic accident: